


India's Most Reliable Intraday Strategy
Trusted and used by 55,000+ Intraday traders in India
NO BRAIN STRATEGY is King Research Academy Most trusted and heavily demanded intraday strategy. People already using it and making a profit every day with minimal capital investment.
NO technical knowledge required.
Anyone can make profit
Find the most active stock
Stop-loss hunting
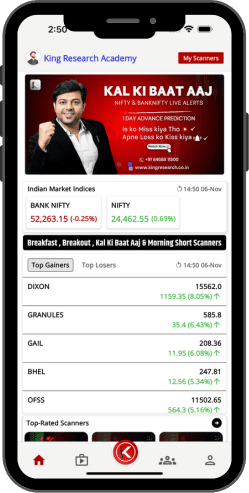
FREE Scanner
Access of Premium Telegram Channel